▲ 5D HIGHAt or near the 5-day high — a notable peak across the last 5 days, not just an intraday wiggle. Brighter glow signals the macro move.
▼ 5D LOWAt or near the 5-day low — a notable trough across the last 5 days. Stronger signal than a routine day low.
▲ HIGHAt or above its 24-hour high. Sell now to catch the peak. Row glows RuneScape-green.
▼ LOWAt or below its 24-hour low. Buy now to catch the dip. Row glows RuneScape-gold.
Browser notifications
▲ BREAKBrowser notifications only fire when a favorite's live price BREAKS PAST its tracked 24h or 5D extreme — a genuine new high/low, not a lingering "near the edge" state. Watermarks update automatically so the next alert needs an even bigger move. 5D breaks are flagged separately because they're rarer / bigger deal.
Margin tags
+1.2M eaEstimated per-item margin from the live insta-buy / insta-sell spread, after the 2% GE tax.
+450K ea avg30-day average per-item margin (for 1M lists). More stable than a one-day snapshot.
Favorite reorder
DragDrag anywhere on a favorite's row to move it up or down the list; the order is saved. Tap 🗑 on a row to remove it, or swipe-left on touch.
Chart markers
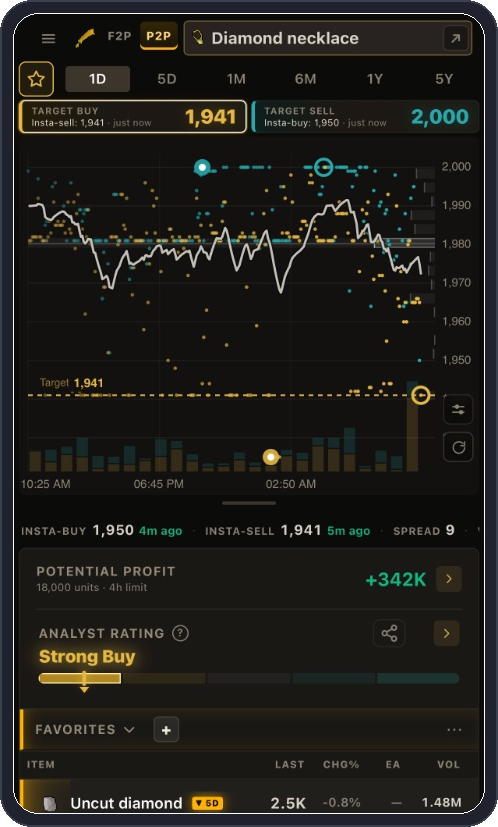
Lows (gold) — insta-sell prints, the price sellers actually accepted. Highs (teal) — insta-buy prints, what buyers paid.
Period Low / Period High — solid dot with a pale centre. The lowest and highest price across the whole timeframe you're viewing.
Recent Low / Recent High — hollow ring. The extreme within just the most recent quarter of the window, so you can tell an old peak from a fresh one.
Trend — the smoothed mid-price line. Follows direction without the print-to-print noise.
BarsTraded volume, gold for insta-sells and teal for insta-buys. On short screens they sit faintly behind the price instead of in their own strip, to leave the chart more room. Tap any point on the chart for its exact price and volume.
Analyst Rating (sidebar gauge — the one opinion on the page)
STRONG BUY … STRONG SELLOne call, scored against the selected chart timeframe's price range: near the window's floor with a real margin reads Buy; near its ceiling reads Sell. Mid-range gets no word at all — the meter's needle sits centred and that is the whole answer, so nothing is put on the line above it pretending to be a call. Underneath, the item is graded twice — once as a buy, once as a sell — and how far apart those two scores land is what decides how strong the word is. A near-tie means the item flips about as well in either direction, so it shows the centred needle rather than picking a side. Expand the gauge to see both scores and the four things that produced them. Because each timeframe has its own price range, the same price can rate differently on 1D and 6M — that's the window changing, not the item. "Buy the Dip" / "Sell the Rip" mean the setup is forming but the price hasn't reached the target level yet. Advisory only — the Target / Swing prices are the actual trade.
Recommended Flip (the ⚡ card)
SCORE / 100How good this particular flip looks right now — not a rating of the item itself. Two things drive it: the net edge after tax (full marks at a 3% edge, and it stops counting above that, so a 12% edge scores the same as a 3% one) and liquidity (full marks at 10M traded a day). If one side hasn't traded recently the score takes a 20% cut. Hover or tap the score on the card to see the exact arithmetic.
THINSOLIDSTRONGPRIMEThin under 55 · Solid 55+ · Strong 70+ · Prime 85+. Because the finder only ever offers flips it has already checked are viable and fillable, a shown pick starts at 20 points before edge or volume are counted — so in practice you'll see the upper bands far more often than Thin. Tap ↻ Next to walk down the ranking; the score falls as the picks get thinner.
Target prices
Target BuyShown on the 1D timeframe — the day-flip bid. 15th-percentile of insta-sell prints in the last ~90 minutes (wall-clock), nudged toward the very-recent realised low. For high-volatility items (24h range >4%) the anchor blends toward 0.5% above the 24h low, so a patient bid can catch multi-hour dips.
Target SellShown on the 1D timeframe — the day-flip ask. -1 below the 85th-percentile of insta-buy prints in the last ~90 minutes, floored at live insta-buy so we never recommend selling below where buyers are paying right now. For high-volatility items the anchor blends toward 0.5% below the 24h high. If the live spread can't beat the 2% tax, both 1D boxes switch to the day's realized dip/peak (recency-weighted percentiles of the day's prints) — the levels worth placing patient orders at.
Swing Buy / SellOn 5D and longer timeframes the boxes switch to swing anchors for THAT window — day trade vs swing trade. Swing Buy sits near the window's realised floor, Swing Sell near its ceiling, using recency-weighted percentiles: a high printed last week counts in full, one from months ago barely counts — so a downtrending item won't quote you a sell level the market left behind. Never the absolute min/max, so one freak spike can't set your target. Longer horizons never quote a worse level than shorter ones — the 1M ask is always at least the 5D and 1D ask, because more patience can always execute the shorter plan. The ask is then held to what's actually placeable: it can't exceed the higher of local resistance (where sellers have been filling over the last ~30 days) and a sanity cap over the live price — 15% on items above 1M, 25% above 100k, uncapped on cheap items that genuinely swing that hard, and doubled when the window is clearly trending up. Without it a year-long slide quotes an ask from the top of the slide, a level the market has left behind. The bid gets no such ceiling: bidding low is always placeable, it just may not fill. Both are defaults — the −/+ buttons override them with no limit. The grade beside each number judges the same window.
GRADE 0–100The score beside each target rates the current price against that same window, and carries a word with it: Steal Buy / Top Sell at 85+, Strong Entry / Strong Exit at 70+, OK at 50+, Weak at 30+, Avoid below that. You'll also see Wait for Dip / Wait for Peak when the setup is forming but the price hasn't arrived, Thin — Hold when the margin is too slim to be worth it, and No Margin when the spread can't beat the tax.
Headline numbers
POTENTIAL PROFITThe per-item margin after the 2% tax, multiplied by the item's 4-hour buy limit — what one full cycle could clear if it all fills, not a per-item figure. Tap it to open the breakdown and edit the quantity.
30-DAY RANGEThe slider under the chart places the live price between its 30-day low and high. Near the left means it's cheap against the last month; near the right means it's near the top of it.
Bank of Gielinor
Stash whatever you're holding — just qty is required, cost is optional. Total Wealth headline shows the live insta-sell value of every stack net of the 2% GE tax. Add a cost basis to track growth; set ±% for swing notifications.
🔔 Notification Center
Share
Neither Reddit nor X can take the image straight from a link — PocketGE copies it to your clipboard so you can paste it into the post.
Bank of Gielinor
Live from RuneLite
Stacks · live value
PocketGE is a trading terminal for the Old School RuneScape Grand Exchange — TradingView-inspired charts, watchlists you build yourself, and scanners that let the trading opportunities come to you. Look for value, look for breakouts. Made easy.
It won't predict the market. Nothing can. What it does is make the OSRS Grand Exchange readable — whether you've been merching for years or you're still working out how the GE works.
Six questions decide every flip. PocketGE is built to answer them:
What should I watch? Watchlists, plus scanners that surface items already at a 5-day extreme.
Is this interesting right now? An analyst rating and a 30-day range meter, read at a glance.
Where do I buy and sell? Target Buy and Target Sell levels, anchored to real recent trades.
How much could I make? Potential profit after GE tax, based on the item's 4-hour buy limit.
What's the risk? The recent range, how much it swings, how fast it fills, and what it did before now.
How has it been moving? Charts from one day to five years, and a 30-day range meter.
👋 Thanks for finding PocketGE — I'm pocketge in-game too, usually around the GE on World 301/302. I'm actively building and improving this based on my own flipping and your feedback. Bug, feature idea, or just want to talk flipping? Add me in-game.
How a flip actually goes
Four steps, in this order. Everything else on the page is in service of one of them.
1 · Put a handful of items on your watchlist
Most OSRS merching comes back to the same dozen items. Star them and each holds a row in the sidebar — live price, 24-hour change, after-tax margin and daily volume side by side — so one glance tells you whether anything moved while you were away. Drag rows into whatever order you think in, sort by any column, and switch off the columns you don't use.
You are not watching for a price. You are watching for the badge in step 2.
2 · Wait for a badge
An item flagged ▲ 5D or ▼ 5D has just hit a five-day high or low. That badge is the signal to open something — not the price itself, not a hunch. It appears in the list before you open anything, which is the whole point of keeping a list.
The bar is deliberately high: an item only earns a badge when its live price is within 0.5% of a genuine 5-day extreme and the 5-day range is at least 3% wide, so a flat item can't pass itself off as a breakout.
Then there's the loud one. When something moves 15% or more against its own 24-hour typical price, the row stops showing a 5D badge and shows the move itself instead — 🚀 +18% or 💥 −15% — and the whole row lights up. A 5-day extreme is routine; a 15% swing in a day is an event, usually an update, a new drop source, or someone dumping a stack. It outranks the 5D badge rather than sitting next to it, because when both are true only one of them is why you should look.
Worth knowing which way to read it: a spike down is the interesting one for a buyer, and it is also the one most likely to keep falling. That is what step 3 is for.
ItemLastChg%EaVol
Diamond
1.8K+1.3%+82.11M
Uncut diamond▼ 5D
2.5K-1.0%—2M
Emerald
417+0.4%+62.57M
Ruby▲ 5D
860+1.6%+103.02M
Watermelon seed💥 -15%
217-15.1%+103242.2K
Two hit a 5-day extreme overnight. The third moved 15% in a day — that one you look at first, and most carefully.
3 · Open the chart and decide: buy, sell, or neither
The badge says something moved. The chart says whether it is worth acting on. Three shapes cover almost every case:
Take the buyPrice has fallen into the bottom of its 5-day range and the after-tax margin is still positive. Bid at Target Buy and wait — you are buying the dip, not chasing it.Take the sellPrice has run to the top of its range. If you are holding, this is the exit — ask at Target Sell. If you are not, this is not an entry.Sit it outMid-range and the two targets are too close together — after the 2% tax there is nothing left. Potential Profit reads No margin and the honest move is the next item.
Pinch or scroll to zoom, drag to pan, tap any point for its price and volume. On desktop, hold Shift and drag a box to zoom straight to a region; double-click to go back. Whenever you have zoomed, panned or nudged a target, the refresh button turns gold — one press puts everything back and pulls fresh prices.
Under the chart, the 30-day range meter answers the one thing the chart doesn't show at a glance: is this near the floor or the ceiling of the last month.
4 · Trade the two numbers
Target Buy and Target Sell are where a patient order has actually been filling — the 15th percentile of recent insta-sells and just under the 85th percentile of recent insta-buys — not the middle of the live spread. Every profit figure underneath already has the 2% GE tax removed, and Potential Profit is scaled to the item's 4-hour buy limit, so it is what one realistic cycle clears rather than an unbounded per-item number.
Neither number is fixed. The − and + either side walk it a gp at a time, ten with shift, a hundred with ctrl (cmd on a Mac), and everything below re-reads off the price you settled on.
Target Buy Insta-sell: 2,441
2,434
Target Sell Insta-buy: 2,486
2,495
Where to bid and where to ask — both already net of the tax.
When you don't have a list yet
Use the Analyst Rating when you already have an item open. Use Recommended Flip when you don't.
Analyst Rating judges the item in front of you. It grades the current price against the selected timeframe's range: near the floor with a real margin reads Buy, near the ceiling reads Sell, mid-range reads neutral and shows no word at all. A read on where the price sits — never a call on where it goes next. Because each timeframe has its own range, the same price can rate differently on 1D and 6M; that is the window changing, not the item.
Recommended Flip finds the item you weren't looking at. It scans the market and hands you one, with a buy level, a sell level, its net edge, the realistic 4-hour fill and the daily volume. Every pick is scored out of 100 on edge and liquidity — Thin, Solid, Strong or Prime — and tapping the score shows the arithmetic. Press ↻ Next for another.
Both are advisory. The target prices are the actual trade.
Recommended Flip
Gold necklace
3.97% net edge · 18K/4h fillable · both sides recently traded
91
Prime Flip
Buy @151Sell @160
Profit+6
Per 4h+108K
Daily vol1.64M
An item you weren't looking for, with the levels to trade it and a score for how good it is.
Volume profile: where the trading actually happened
The bars under the chart say when volume happened. The volume profile — the horizontal bars stacked against the price axis — says at what price. The longest bar is the point of control: the level more gp changed hands at than any other, drawn as a line straight across the chart so you can see where price sits relative to it.
It is a magnet and a fence. Price tends to drift back toward the point of control, and tends to stall at it on the way through. A buy target below a heavy profile has support under it; a sell target just under one is asking into a wall.
The longest bar is where the most gp traded. Its line runs across the chart so you can read price against it.
Turning it off. On desktop the chart toolbar sits under the chart next to Refresh: Fill shades the band between buy and sell, VP toggles the volume profile. On a phone the same two live behind the small slider button in the chart's bottom-right corner — tap it and they stack above it. Both remember your choice on that device, and the profile starts on, because it is the part nobody would think to go looking for.
On a phone
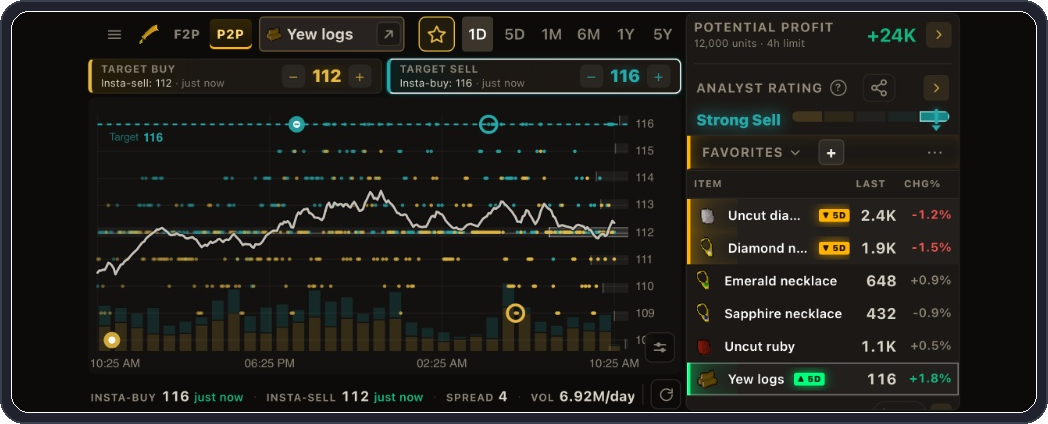
Nothing here is a cut-down mobile version. Held upright you get a vertical stack — targets, chart, then the watchlist under it — so scrolling the list never costs you the chart. Turned sideways you get the desktop split, chart on the left and the watchlist and rating panels on the right, both visible at once. Two layouts, not one scaled.
Upright — targets, chart, then the watchlist under it.
Sideways — the desktop split: chart left, watchlist and ratings right, both at once.
Add it to your home screen and a service worker loads the shell instantly with no URL bar. On iOS that step is also what enables notifications — the bell button walks you through it.
Scanners: a shortlist when you don't have one
Not knowing what to look at is the hardest part of starting. At 5D Highs and At 5D Lows hand you a shortlist of items already at an extreme, and Biggest Losers (24h) is where the day's hardest falls surface — the ones carrying a 💥 flag.
The bar to get on it is deliberately high: an item only appears when its live price is within 0.5% of a genuine 5-day extreme, and only if the 5-day range is at least 3% — so flat items can't pass themselves off as breakouts.
The same 🚀 / 💥 flags from your watchlist appear on every row a scanner returns, so browsing works the same way watching does: you are looking for a badge, not reading every number. Anything at ±15% against its own 24-hour typical price is showing you the move instead of a 5D badge, and that's the row to open first.
The margin lists split by how fast an item fills, which is really a question about your own time:
High Vol — gems, ores, bars, arrows, runes, cannonballs. Small edges that fill fast. Suits sitting at the GE and cycling.
Low Vol — quest gear, rares, niche supplies. Bigger spreads that take hours. Suits placing an offer and going to do something else.
Both sort by gp per flip after tax.
Bank: know what your stacks are worth
A stack you're sitting on is a position, and its value moves whether you're watching or not. Log one with its quantity and, if you want P&L, what you paid — valuations refresh every 5 minutes with running profit per stack and a total at the top.
Give any stack a ±% threshold and a browser notification fires when it crosses. For long holds, where you want to hear that your sigil stack dropped 10% without watching a chart all day.
Alerts you can actually verify
You should never have to wonder whether an alert is really armed. The 🔔 button lists every one: each favorite, firing when its live price breaks its 24-hour or 5-day extreme — 5D flagged separately, because those are rarer and bigger — and each Bank stack with its threshold editable inline.
There's a master switch and a test-fire button that proves the browser permission actually works. The tab title carries an (N) badge counting favorites at a 5-day extreme right now, so a background tab still tells you when something needs eyes.
No signup, nothing leaves your browser
PocketGE never asks for an account or your RuneScape login. Favorites, Bank stacks and settings live in your browser's localStorage — clear your cache and they're gone, which is the same reason none of it reaches a server. Prices come from the public OSRS Wiki real-time prices API, long-range history from Weird Gloop.
Frequently asked questions
New to merchanting? Read the full OSRS flipping guide — GE tax, buy limits, picking items, and setting offers that actually fill.
What is PocketGE?
A trading terminal for the Old School RuneScape Grand Exchange. Live prices and charts from one day to five years, watchlists you build yourself, suggested buy and sell levels, and every profit figure with the 2% GE tax already taken out. It also scans the market for flips, tracks what you're holding, and alerts you when a watched item breaks out. Free, no account, and it never touches your RuneScape login.
What do Target Buy and Target Sell actually mean?
They're suggested order levels, not the current prices. Target Buy sits around the 15th percentile of recent insta-sell prints, Target Sell just under the 85th percentile of recent insta-buys and never below what buyers are paying right now — so they're where a patient order has been filling, rather than the top and bottom of the live spread. On 5D and longer they become Swing Buy and Swing Sell, measured against that wider window. Every profit figure shown is what's left after tax. They're a suggestion; you still place the order, and you can nudge either one with the − / + buttons.
What's the difference between the live spread and the margin?
The spread is just insta-buy minus insta-sell right now, before tax — that's the SPREAD figure under the chart. The margin is your actual edge: Target Sell minus Target Buy minus the tax, which is what the Ea column and Potential Profit use. They can disagree badly. A 2,000 gp item showing a 40 gp spread keeps nothing once the 40 gp tax lands, which is exactly why the margin is the number worth reading.
How do I know if an item is worth flipping right now?
Four things, all on the item page. The Analyst Rating grades it as a buy and as a sell and shows both scores plus the four inputs behind them, so you can check its reasoning instead of trusting a word. The 30-day meter shows whether the price sits near its floor or its ceiling. Daily volume tells you whether it will actually fill. A 5D badge means it's at a genuine multi-day extreme, and a rocket or explosion flag means it moved 15% or more against its own 24-hour typical price — a much louder, rarer event. If they don't agree, that itself is the answer — it's not a clean setup.
I'm new, or I don't have much gold. Is this still useful?
Yes, and the numbers are built to be honest about size. Potential Profit is scaled to the item's 4-hour buy limit rather than quoting an unbounded per-item figure, and Capital Needed sits right beside it so you can see the stake before the reward. Start with the High Vol list: cheap, liquid staples like gems, runes and bars fill in minutes, so you learn the rhythm without tying up gold you don't have. The flipping guide covers buy limits, tax and offer placement from zero.
Does PocketGE need my RuneScape login?
No, and there are no accounts at all. It reads the public Grand Exchange price API and nothing else — there is nothing to log into and no way for it to touch your account. Favorites, Bank stacks, alert thresholds and settings live in your browser's localStorage, which is also why clearing your cache clears them: none of it is ever sent anywhere. You can install it to your home screen and it still works this way.
How is this different from just looking at Wiki prices?
The Wiki gives you the live insta-buy and insta-sell, which is the raw data this is built on. PocketGE adds the parts you'd otherwise do in your head: target levels anchored to where orders have actually been filling, the 2% tax removed from every profit figure, an Analyst Rating that shows its working, a scanner that hands you a flip with concrete levels, watchlists with breakout alerts, and flags for items sitting at a 5-day extreme.
Do I have to sit at the GE all day?
No — it's built for checking in. Star the items you trade and the watchlist shows price, 24-hour change, after-tax margin and volume side by side, so one glance tells you if anything moved. Alerts fire when a favorite breaks its 24-hour or 5-day extreme, and the tab title carries a count so a background tab still tells you. The Bank tracker watches what you're holding and can notify you on a ±% move.
Will this tell me what to buy so I can't lose?
No. It doesn't predict prices and nothing can — the Analyst Rating and Recommended Flip describe where a price sits and what the current edge is, not where it's going. Orders don't always fill, prices move while you wait, and a good-looking setup can still go against you. What this does is make the numbers that decide a trade readable in one place so you're choosing on better information. The decision stays yours.
What's the difference between High Vol and Low Vol items?
How fast they fill, and how much each flip pays. High Vol covers items trading 100,000+ a day — gems, ores, bars, arrows, runes, cannonballs — where margins are thin but orders fill in minutes, so profit comes from cycling capital repeatedly. Low Vol covers slower items with much wider spreads: quest gear, rares, niche supplies, where one flip pays well but can take hours. They're listed separately so you don't tie up gold in a slow item expecting a fast one.
What does the Recommended Flip score mean?
How good that particular flip looks right now — not a rating of the item. Two things drive it: the net edge after tax, which maxes out at a 3% edge, and liquidity, which maxes out around 10M traded a day. If one side of the trade hasn't printed recently the score takes a 20% cut. Under 55 is Thin, 55+ Solid, 70+ Strong, 85+ Prime. Hover the score to see the exact arithmetic, and press Next to walk down the ranking.
What does a 5-day high or low badge mean?
The live price is within 0.5% of — or through — its highest or lowest point over the last five days. It only appears when the 5-day range is at least 3% wide, so flat items can't false-positive as breakouts. Gold means a 5-day low, green a 5-day high. It's a flag that something unusual is happening, not an instruction: a 5-day low can be a dip worth buying or the start of a slide.
How does the 2% Grand Exchange tax work?
Selling costs 2% of the sale price, rounded down, capped at 5,000,000 gp per item. Items under 50 gp are exempt, as is a short list of tools. Old school bonds skip the 2% but carry a bigger fee of their own: a bond bought on the Grand Exchange arrives untradeable, and making it sellable again costs 10% of its value — so PocketGE charges bonds 10%, which is why they almost never qualify as a flip. Every margin here already has the right fee removed.
What is a buy limit?
The most you can buy of one item in a rolling four-hour window, set per item by Jagex. It caps what a single flip can make per cycle, which is why Potential Profit multiplies the per-item margin by that limit instead of quoting an unbounded number. It's also why a huge per-item margin on a limit of 8 is often worth less than a few gp each on a limit of 30,000.
Popular OSRS item prices
Jump straight to any of these — live insta-buy / insta-sell, target flip prices with the GE tax baked in, period and recent highs and lows, and 5-day breakout markers for each.
New & recent items (2025–2026 updates)
Fresh drops settle fast and swing hard — track the newest gear from The Blood Moon Rises (Maggot King), Doom of Mokhaiotl, Yama and the Royal Titans while the market finds its price.
Jagex is raising the Grand Exchange gold cap (mixed gold + platinum token payments, planned for late 2026), which finally puts over-max rares like the 3rd age axe and 3rd age bow on the open market. Every 3rd age piece, tracked live:
 PocketGE